10.5 Customer Insights
Customer Insights window can be found under the Statistics menu option and will display an overview of the behaviors of all active recipients. For example, their open and click behaviors will be analyzed using the Reaction Types chart. It will distinguish between the following behaviors.
Opportunity: all recipients who have opened and/or clicked on a mailing at least once in the last 90 days, regardless of how much time they spent with the distributor.
Lead: these recipients have spent less than 90 days with the distributor and have not yet opened or clicked or the last transmission was more than 90 days ago (lastsenddate \< sysdate-90 or lastsenddate is zero).
Sleeper: all addresses that have not opened a mailing in the last 90 days or clicked on one, although you have received mailings during this period and have been active for at least that long. [creationdate \< sysdate-90 & (lastopendate \< sysdate-90 or lastopendate is zero) & (lastcklickdate \< sysdate-90 or lastclickdate is zero) & lastsenddate >= sysdate-90].
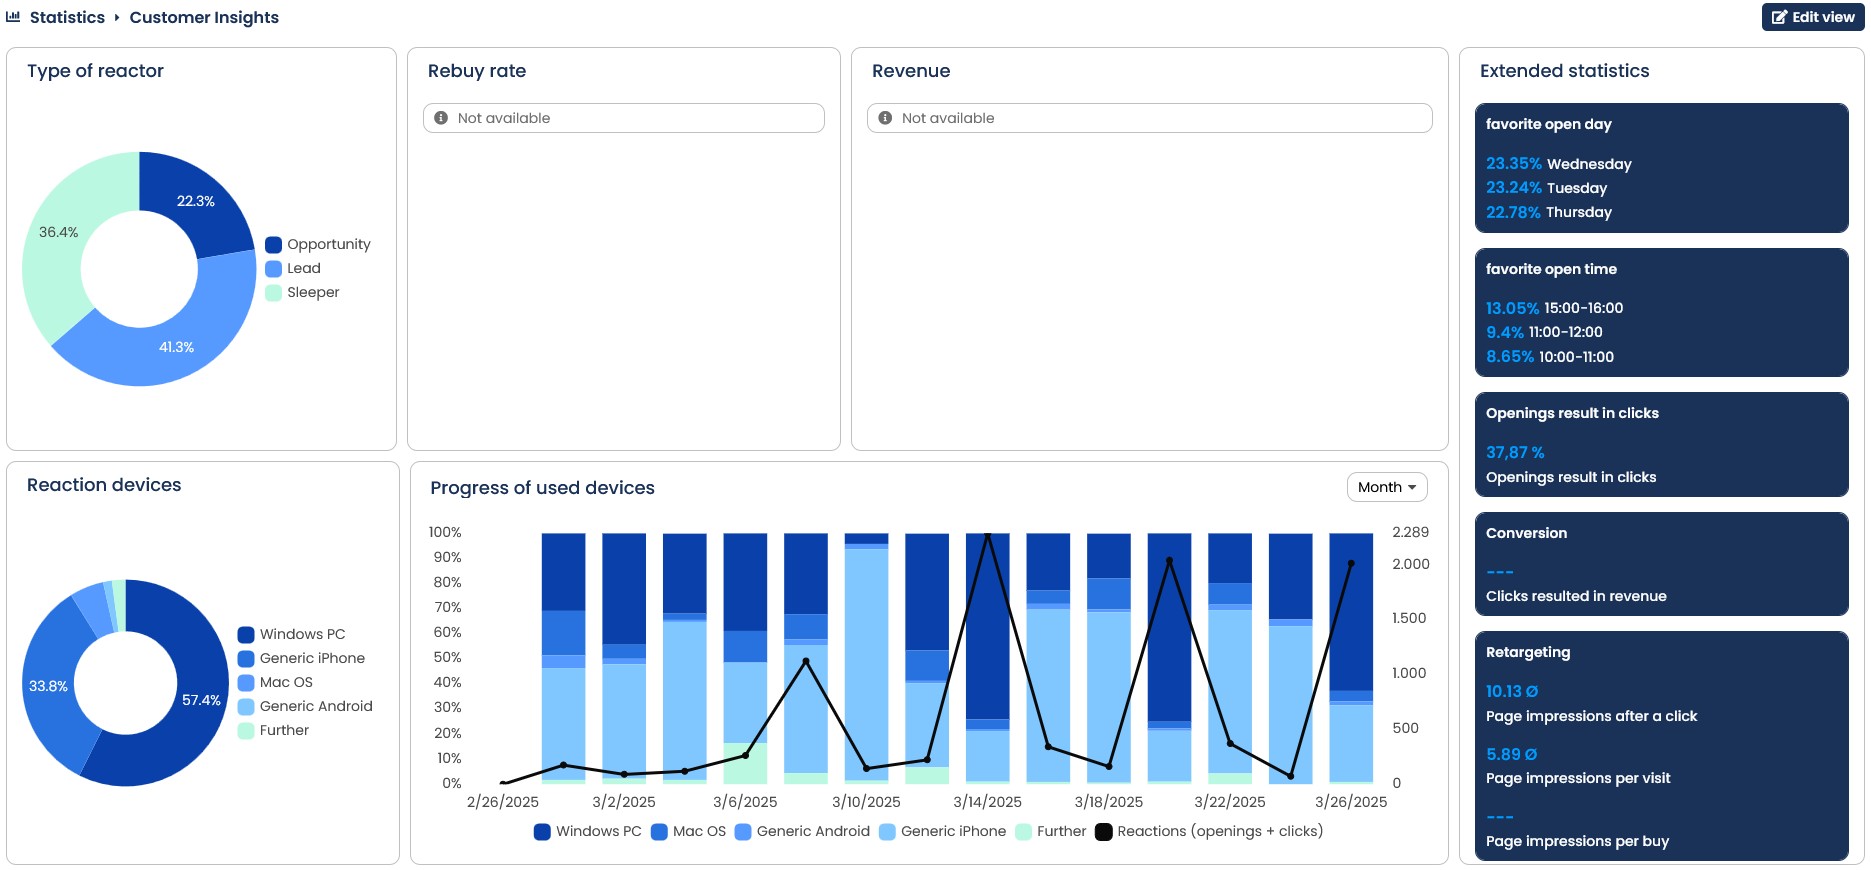
Fig. 9.20: Customer insights provides you with information about the behaviour of your recipients.
If the revenue measurement is used, the chart will display the Rebuy rate. Furthermore, it will provide information such as the probability that a customer who once bought something due to a newsletter will make two or more purchases.
All buyers will be grouped on the Revenue chart based on their revenue according to the Boston Consulting Group Matrix (BCGM). The revenue measurement is a requirement for getting these values here.
From the bar graph Progress of used devices, you can see whether and how the proportions of individual devices change over time. This enables you to recognize in good time when a significant user group is using a new device and to take this into account during optimization. In addition, you can see how many reactions were recorded in the period under consideration.
The Reaction devices chart will provide information about the device used for the responses.
Note: Some statistics that are generated by using response data, can't be displayed for (sub-)user because the information is being saved in the master user.
The right panel of the Customer Insights window will show you information about the most favorite open day, most popular opening time, Openings result in clicks, conversion and retargeting.
The Openings result in clicks shows how many of your opened mailings have also actually been clicked. The conversion rate shows the clicks that have ultimately generated revenue. However, they can only be provided if the revenue measurement is used. Depending on whether or not you have subscribed to the re-targeting package, you will receive additional information about the page impressions after a click, meaning how often a page has been opened after clicking a mailing on average. The page impressions per visit provides the average number of times that the page was opened per visit to the web site and the page impressions per purchase indicate the number of times the page was opened until a purchase was made.