10.2 Mailing statistics (separate)
The statistical overview gives you a list of all newsletters sent so far, in the Mailing (separate) section. You can either filter out one of your newsletters by using the Filter feature or simply click on one of the mailings in the Mailing column to select it for evaluation.
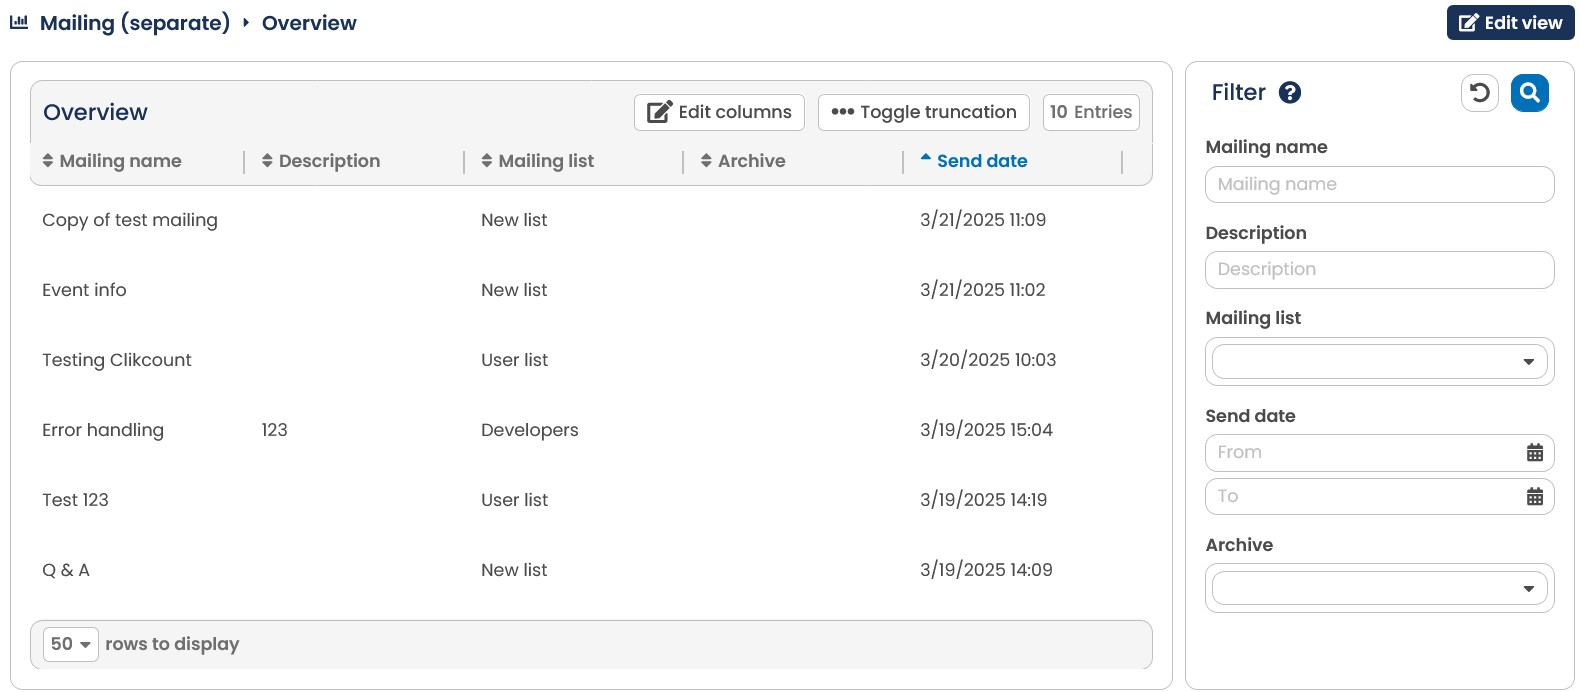
Fig. 9.3: The E-Marketing Manager lists all available mailings in the overview of the Mailing (seperate) submenu.
Please note: The key figure accepted mails in the mailing summary will be hidden due to the data being only archived for 90 days. 90 days is the default setting but can be changed individually. If you are interested in changing the default settings, please contact our support.
You have the possibility to filter the displayed mailings according to mailing lists.
By clicking on the Edit columns button, you can add further columns to the overview. You can choose from: created on, template, subject, target groups, mailing ID and recipient. Select as many as you like and then click on Save columns.
10.2.1 Summary
The E-Marketing Manager mailing statistics is subdivided into several sections, that can be evaluated individually via a drop-down menu. After selecting a mailing, you see as standard the Summary section that presents you with the most important indicators. Calling the drop-down menu next to Select Statistics you can furthermore choose to see the following statistics: Click statistics per link, Progress of clicks, Progress of openings, End device statistics, Bounces, Top Domains, Revenue (only visible if you have integrated the measuring pixel Revenue on your order confirmation page), Progress of delivery and Benchmark.The section Click statistics per link will be presented in detail further on in this chapter. You can read more on the sections Progress of clicks as well as Progress of openings in chapters Opening rate and Progress of Clicks. Chapter Bounce statistics concerns Bounces and in chapter Shop Tracking you can learn all about shop measurement, which the Revenue link refers to.
Please note: If desired the Summary is not loaded by default after selecting the mailing, but only after clicking on the entry in the selection menu. This is useful when other statistics are often needed because the overall loading times are shortened in this way. You can make this setting yourself or an administrator under Administration in your user settings in the Statistics summary field.
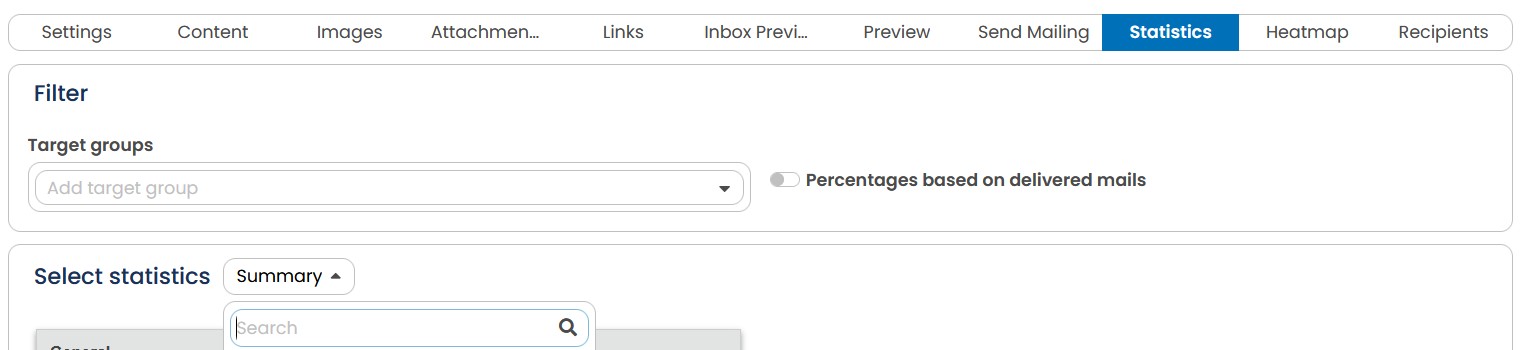
Fig. 9.4: In the upper part of the statistics tabs you can define your target group and use sent mailings as a base for percentage values.
Your target group can be entered at the upper part for the mailing statistics. By clicking on Refresh, the following tables are supplemented with additional columns for each target group. These can be used to evaluate the recipient behavior for this particular target group and, for example, compare it with the overall distributor. If you only want to analyze the target group you have written to, you do not have to make any restrictions here. You can also use the Percentages based on delivered mailings option for the Summary statistics. To do so, enable the slider control with the same name. By default, the percentage values will be calculated for Opened, Clicked and Logged Off based on the email messages sent. In the Select statistics drop-down menu, the Summary is loaded first by default. Here you can also switch to the other statistics. The Action button offers the options to save the statistics data as CSV or to get a standard report with the Generate PDF Report button.
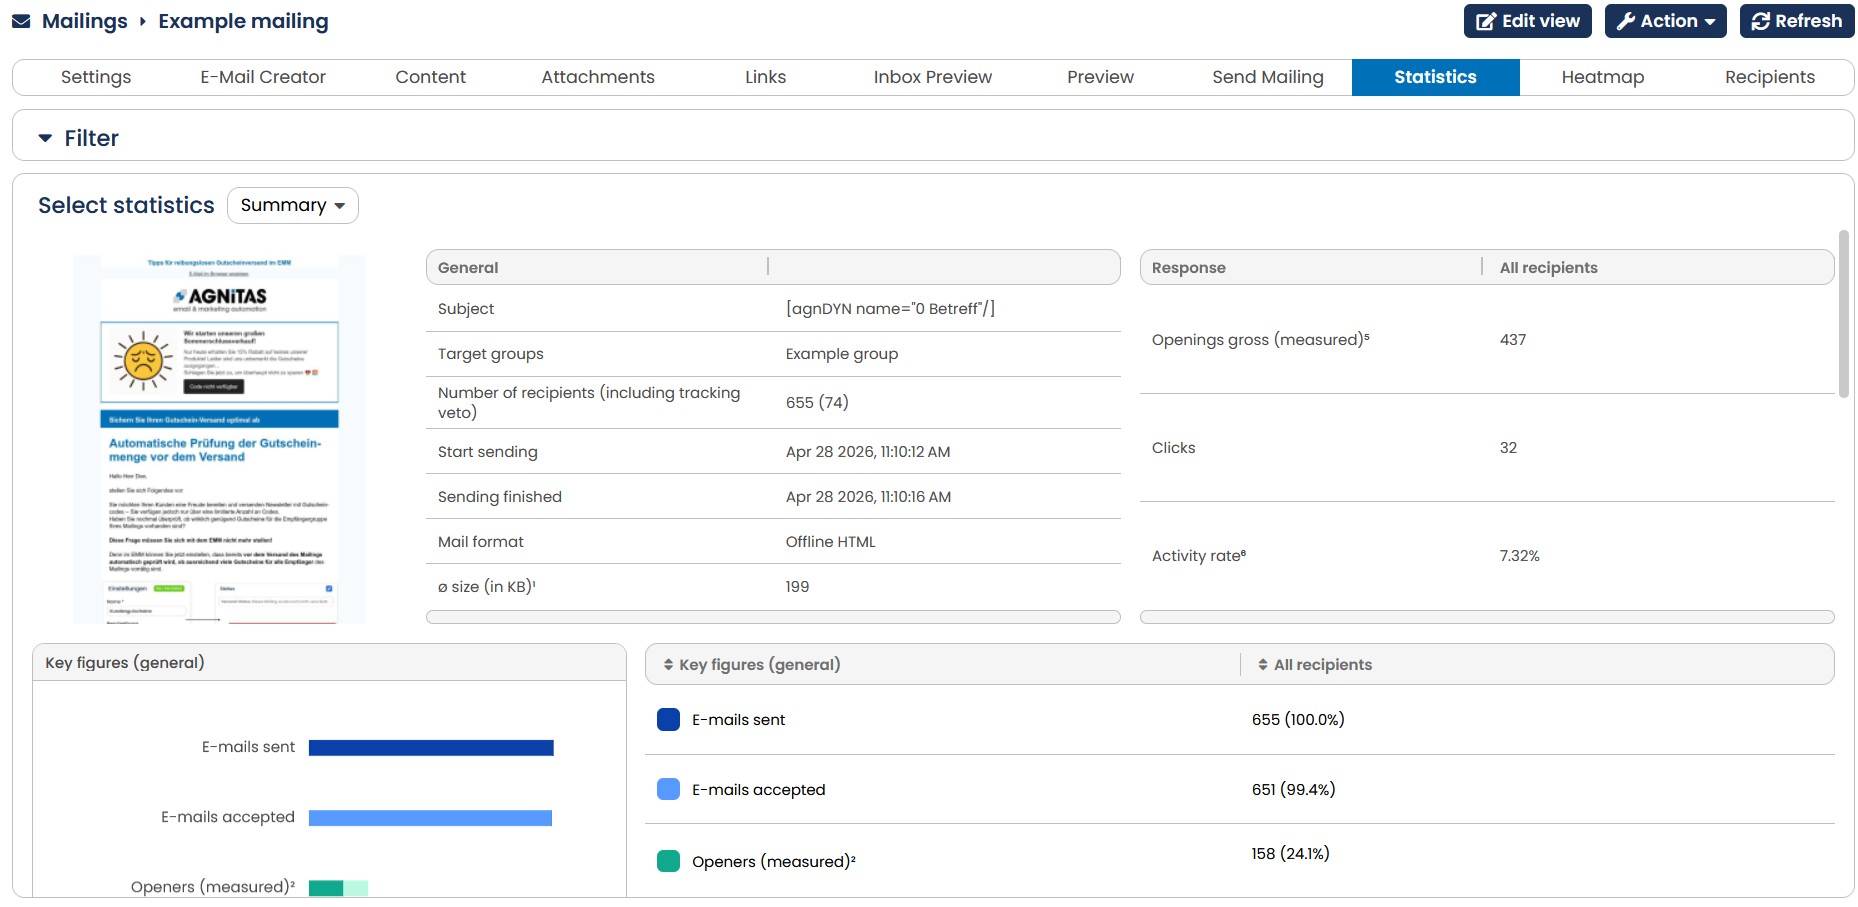
Fig. 9.5: The Mailing statistics show important indicators concerning a selected mailing. Scroll to see all the data.
E-Marketing Manager displays the most important statistics for the selected mailing in the
Summary.
The first tables show the most important facts of the mailing, like subject, used target groups, Number of recipients (including tracking veto), Start sending, mail format and size are shown. In the case of date-, action- and interval-based mailings, the evaluation period for the statistics and when the mailing was sent for the very first time are also specified. In addition, above the first table, when selecting Day, Month and Period, a possibility to select the period is displayed.
Action-based, date-based and interval-based mailings offer the additional possibility of setting a time range. The respective tabs appear to the left of the Select Statistics dropdown menu.
This is followed by a bar chart showing the relevant key data. E-Marketing Manager distinguishes between E-mails sent, E-mails delivered, Openers (total, measured and invisible), Clickers, Opt-outs, E-Mails sent and accepcted, without confirmation of receipt and Revenue. You can find out more on the subject of soft- and hardbounces in chapter Bounce statistics.
Note: Outside the retention period, no values can be determined for Without confirmation of receipt. All deliveries without a hard bounce are then considered delivered.
After the first bar chart, E-Marketing Manager delivers the numeric information in a tabular overview (absolute and percentage values). Here you also find information on accepted emails and hardbounces. In addition you see how high the opening and click rates in your mailing are. The figures for opener and clicker refer to recipients who have opened or clicked at least once, but may have opened or clicked several times. The recipient is counted only once here, in contrast to openings and clicks over time - here a recipient can be counted several times. E-Marketing Manager distinguishes between measured openers and invisible openers for the openers value. The value Openers (measured) contains all the recipients, who opened the mailing with images at least once. The dark green part of the bar indicates the proportion of proxy openers. These are, for example, openers of Apple operating systems or Yahoo Mail Proxy. Since proxy servers load images automatically, it is possible that no real opening has taken place. The value Openers (invisible) is an extrapolation of the clicking recipients who opened the mailing with suppressed images. The value Openers (total) is the sum of both values. If desired, softbounces can be shown next to the hardbounces in this statistic. Anonymous openings is the number of people who opened the mailing but activated the tracking veto. You can also see from the statistics how many clickers responded to your mailing and the number of unsubscribers. The values for sales are only displayed if you have stored the Revenue measurement pixel on your order confirmation page.
Note: Please be aware that follow up mailings and campaigns based on opens can be significantly skewed by proxy opens if the percentage of Apple recipients is very high. It may be that incorrect content is delivered for these recipients, since the recipient himself has not actually opened. Particularly in the case of longer-running mailings such as date- or action-based mailings, special effects such as an open rate of over 100 percent can occur in the statistics due to time shifts, e.g. dispatch at the end of June, opening/click at the beginning of July. Unfortunately, the evaluation periods for these mailing types cannot be linked to the dispatch.
Please note: The value for E-mails accepted is the current number of e-mails sent minus the temporarily not-deliverable e-mails and the hardbounces. E-Marketing Manager continues to attempt to deliver these e-mails within the next day. This value is only stored 180 days in your E-Marketing Manager. If you are interested in displaying the value Softbounces, please contact your Key Account Manager.
In the table devices, E-Marketing Manager differentiates openings and clicks for device types A distinction is made between recipients who responded to the mailing with only one device type (PC, Tablet, Mobile, Smart TV) and recipients who opened or clicked on the mailing with more than one device type (multiple devices). Recipients who have used multiple devices no longer appear in the key figures of the other device types, the program shows a graphic representation of this opening behavior on the right next to the numbers material.
Furthermore, at the very end you will receive information on all reactions: The E-Marketing Manager gives you the gross openings, gross clicks as well as an activity rate that corresponds to a click-through rate and puts the clicks in relation to all openings.
10.2.2 Click statistics per link
If you want to evaluate the measurable links of your mailing more precisely, click on the link
Click statistics per link in the selection menu. On the following page, the E-Marketing Manager displays both the clicks and clickers (in percent and absolute values) for each measurable link in the mailing. The clicks also include recipients who have clicked the link several times. The clickers, on the other hand, record how many recipients clicked on the measurable link; double clicks do not count. Recipients with tracking veto are excluded here. Unfortunately, it is not possible to determine how many different people clicked anonymously, so only the number of all clicks can be determined here. In the statistics, you can also see how high the proportion of mobile link clicks per link is.
In the Click Statistics per Link menu E-Marketing Manager will differentiate between Administrative links and Production links. Links to your offers will be included in this last category, Production links. Administrative links means links that do not have a direct association with the mailings content, such as logging off or opening a Full Screen view.
You can designate any number of measurement links as Administrative links, such as a link to the General Terms and Conditions page or the Legal Disclosure page. E-Marketing Managerwill treat all other measurement links as Production links. The Editing links and Preparing trackable links for mailing statistics chapters contain more information about these issues.
To improve transparency, the link descriptions (if provided under Tracking Links) or the Alt-text for the link (if specified in the HTML code when the mailing was created) will be dissplayed instead of the entire link.
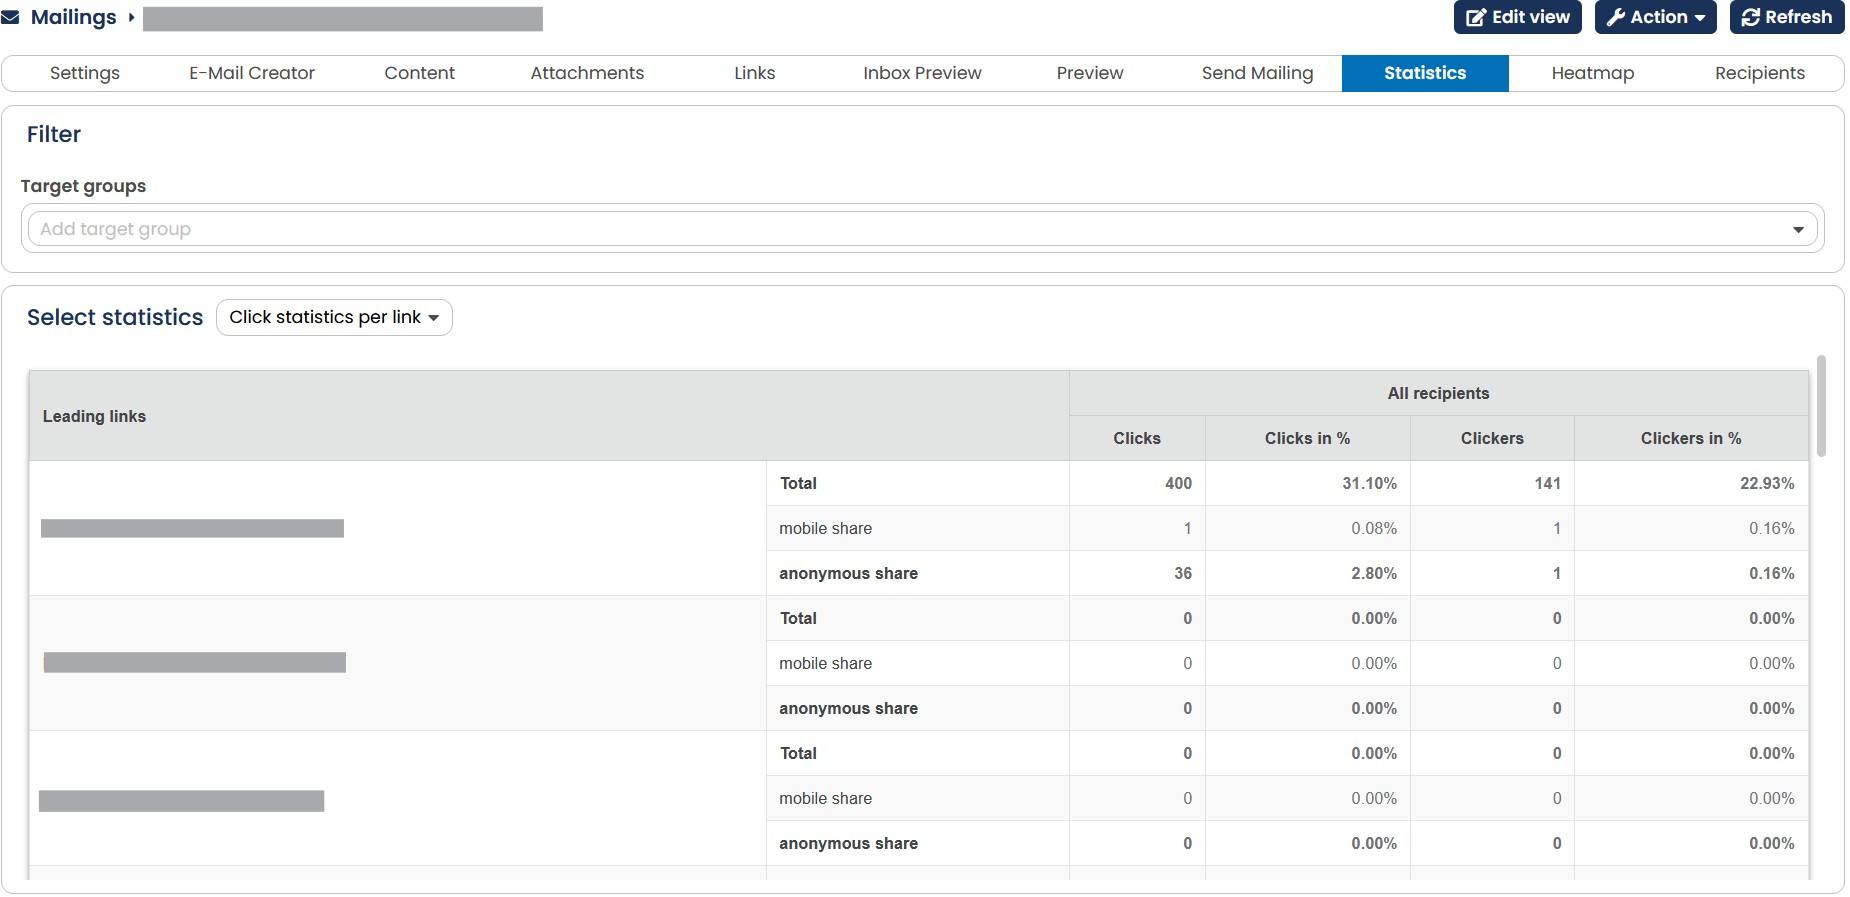
Fig. 9.6: The E-Marketing Manager shows the clicker and click rates for every trackable link (scroll to see all the data).
Selection can also be restricted to a certain demographic (or target group) in turn. Simply select the corresponding target group from the selection list. Once the selection has been made, click Refresh.
10.2.3 Progress of delivery
E-Marketing Manager will show the period of time over which your mailing has been delivered if you so desire. The use of statistics provides you with important mailing information since not all mailings can be delivered at the same time. Some can, for example, come back as softbounces because the recipient's mailbox is full or the server concerned is temporarily unavailable.
To select the delivery statistics, under Mailing (separate) select the desired mailing and then, on the Statistics tab shown as standard, click on the Progress of delivery option in the drop-down menu next to Select Statistics. E-Marketing Manager will now show you the delivered emails sorted according to date. You can choose whether you want the see delivery progress of the last 10 hours, the last day, the last month or for a certain period of time.
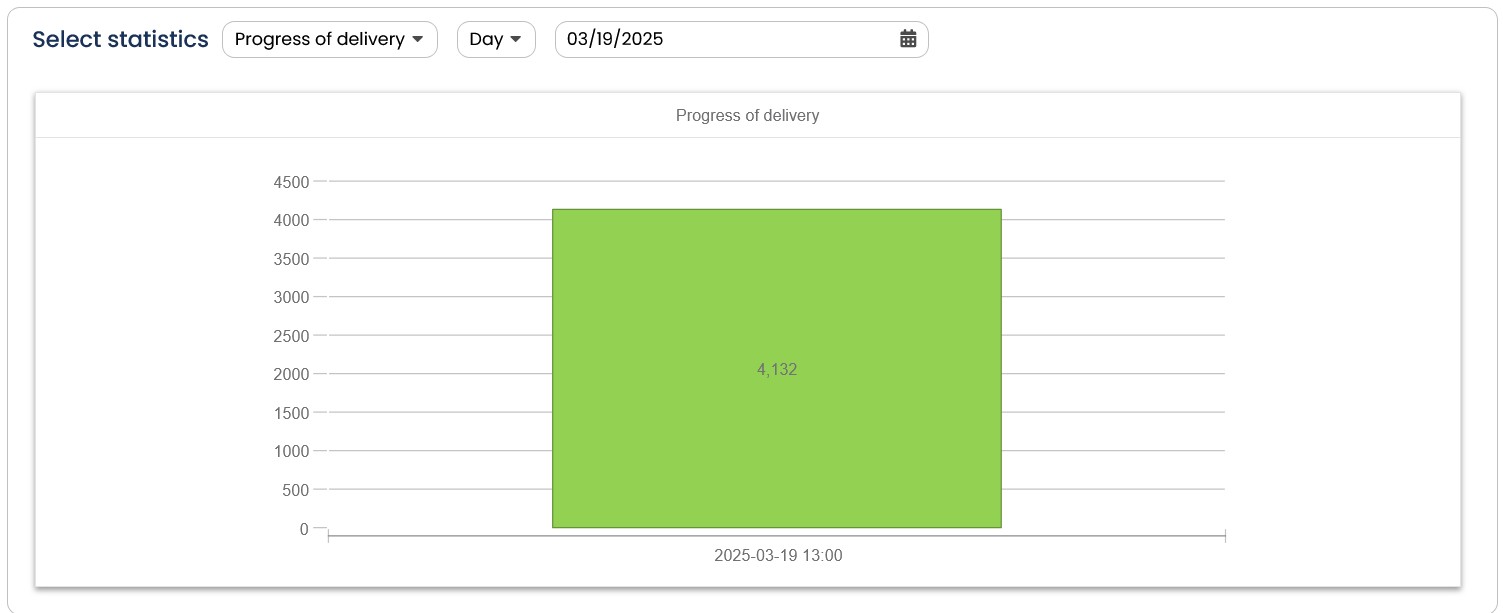
Fig. 9.7: E-Marketing Manager shows the period of time over which a mailing has been delivered.
10.2.4 Progress of openings
If you want to figure out how many emails have been opened by the recipients, you must use the mailing in HTML format. You can decide whether you want to measure the open rate in the drop-down menu Measure opening rate (see chapter Entering basic mailing data) or you can insert into the text of the HTML version of the AGNITAS tag [agnONEPIXEL] yourself (see chapter Creating customized mailings). In both cases, a picture of 1x1 pixel size added. This image file is saved on the AGNITAS server. When the recipient opens the mailing the e-mail program loads this image file, the AGNITAS server registers this and knows that the mailing is opened. For text mailings this procedure is not possible and if the mailing was opened with image suppression, no opening can be measured either. In a mailing with mixed format the opening rate is only a hint and not the number of all opened mailings.
If you want to analyze the openings of the invididual target groups, choose a target group in the Target group drop-down. Confirm your settings with a click on the Refresh button.
Please note that E-Marketing Manager displays openings across time for all device types in a separate diagram when one or more target groups are selected. Only when no target group is selected does the information for all device types appear in the same diagram.
You can display the gross and net click rates of each trackable link with the two links Progress of clicks and Progress of openings respectively for a self-defined period of time, the previous day or over the entire previous month both numerically and graphically. To do so, select Period, Day or Month in the drop-down menu. Selecting Period lets you choose an individual time range.
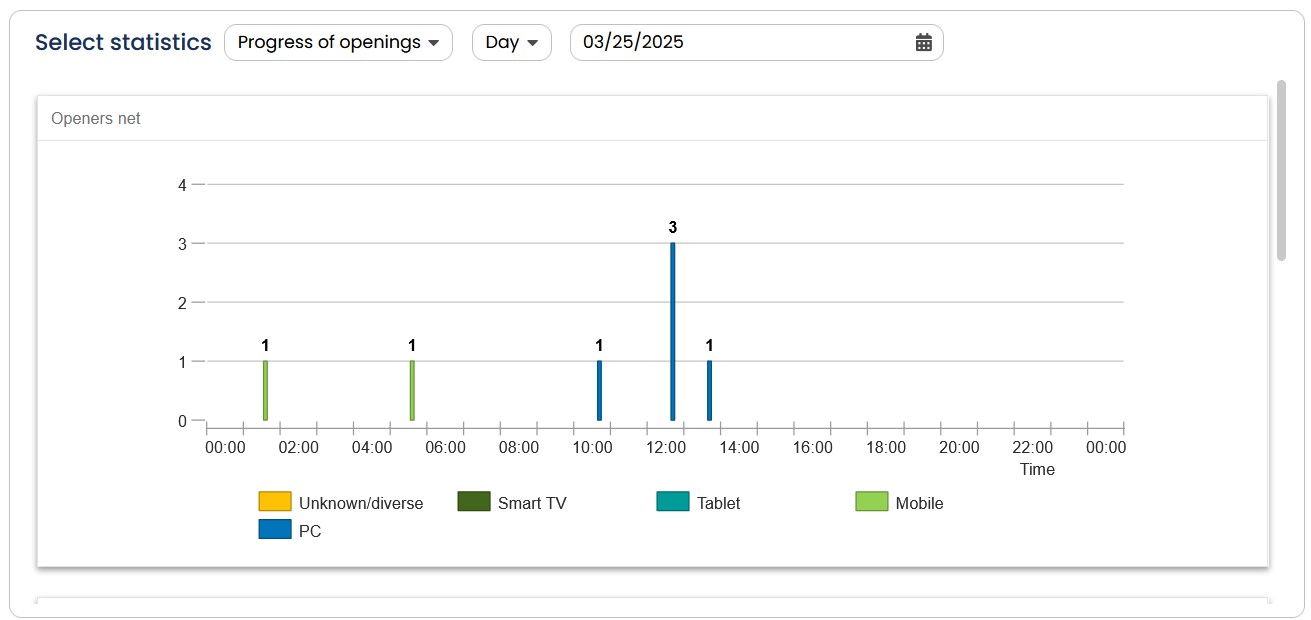
Fig. 9.8: The E-Marketing Manager shows the chronological sequence of the opening rates per hour, per day or per month (scroll to see all the data).
If no target group is selected, E-Marketing Manager shows the openings across time, split for the different devices. If a target group is selected, the program creates a separate diagram for different device type data.
Please note: You can export this statistic by clicking on the corresponding button under Action.
10.2.5 Progress of clicks
The click statistics over time show you the distribution of clicks over the selected period. The diagram can only show you values if you use measurable links in your mailing.
If you want to analyze the clicks for individual target groups, select the desired target groups from the selection list. Click the Refresh button to confirm your choices.
Please note that E-Marketing Manager will display clicks over time using a separate graph for mobile end devices when one or more target groups have been selected. The information for mobile end devices and traditional PCs will only be displayed using the same graph when a target groups has not been selected.
Note that if you select one or more target groups, the OpenEMM displays the clicks over time for mobile device types in a separate diagram. Only if no target group is selected do the specifications for all device types appear in the same diagram.
The click statistics over time can be viewed for different time periods. To do this, click on Day or Month. Optionally, a time period can also be specified.
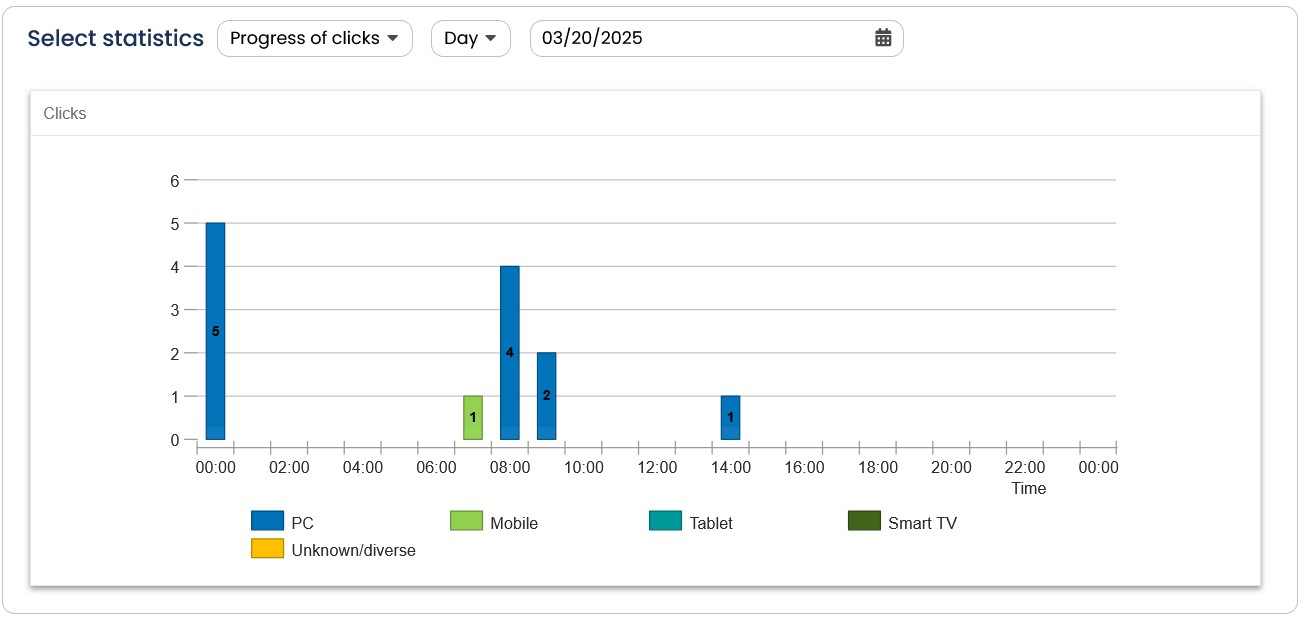
Fig. 9.9: The click statistic will either be displayed by the day, the month or a self-defined period of time (scroll to see all the data).
As long as no target group is selected, the E-Marketing Manager shows the Progress of clicks separated in multiple devices, PC, mobile, tablet and smart TV. After you chose a target group the E-Marketing Manager creates a separate statistic which includes the data of all devices.
Note: You can export this statistics by clicking Action and there save as CSV-file.
10.2.6 Top Domains
The Top Domains statistics is a great E-Marketing Manager tool providing you detailed information on the most important email domains of your recipients.
In the upper area you can set the amount of domains you would like to see. Choose between 5, 10 or 15 domains. When ticking the check box Top Level Domains, the EMarketing Manager will show you the statistics based on the domains' endings. In addition, you can select a target group.
The display is always the same: You first see a bar chart and a table which indicates the recipient number (in absolute and percentage values) in addition. In total you can therefore evaluate the values the E-mails sent, Hardbounces and Softbounces as well as Openers and Clickers. Clicking on the Action button in the upper right, gives you the possibility to export this statistics as CSV.
If you wish to receive data on non-mailing affiliated domain info, just go to the Statistics sub-menu point Domain Overview. You can find detailed information on this in chapter Domain overview.
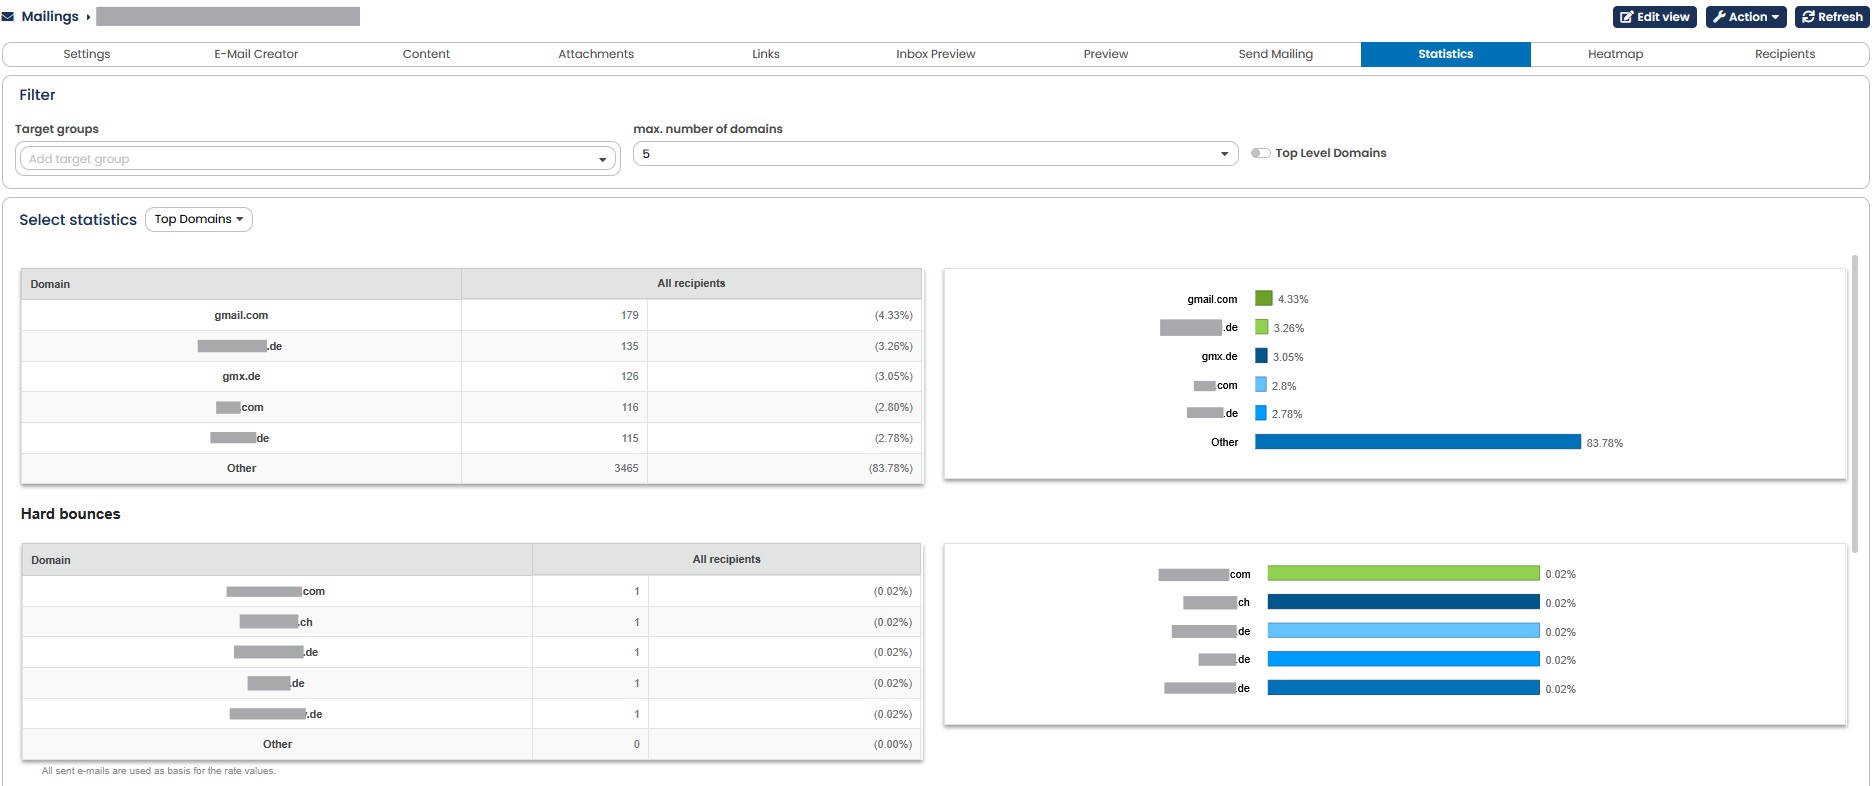
Fig. 9.10: The Top Domains statistics shows you an overview of the most important domains your mailing has reached (scroll to see all the data).
10.2.7 End device statistic
You can use the end device statistics to review the end devices that were most often used to open your mailing or click on it.
The PC table at the top will show the operating system used to open and click on your mailing, if the end device was a PC. The Mobile and Tablet sections will show the actual end devices that your recipient used to view the mailing. In addition to the absolute number of openings and clicks, you also receive the percentage value in relation to the total number of openings and clicks.
The ten most frequently used end devices will be represented in color based on their percentage values and in relation to the opening rate and click rate using a pie chart.
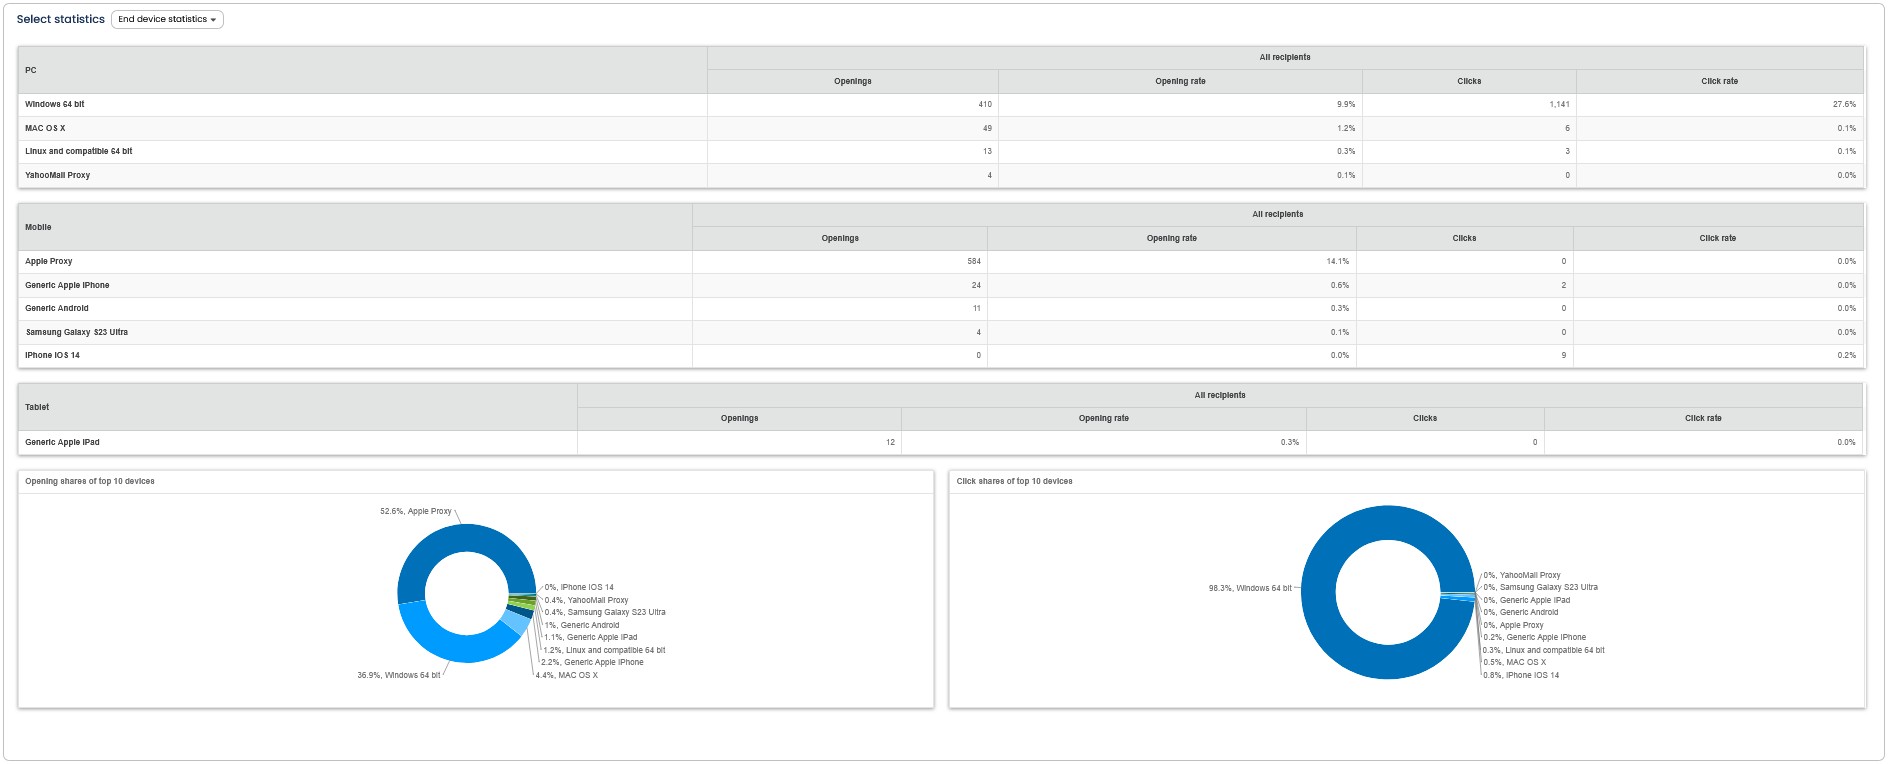
Fig. 9.11: By using the end device statistics you gain a broad view over the most important end devices with which your mailing was opened (scroll to see all the data).
10.2.8 Bounces
E-Marketing Manager also provides you with additional information on bounces. Choose
Bounces in the selection menu. The statistics Bounces shows you the causes for
undeliverability and delivers a graphical overview of the bounces. E-Marketing Manager distinguishes between two types of bounces:
Softbounces:
-
Problems with mailbox (e.g. mailbox full)
-
Problems with recipient (e.g. temporarily unavailable)
-
Other softbounces (all other softbounces)
-
Total (qualified softbounces): Sum of the first three types of softbounces
-
Dispatched without confirmation of receipt (including softbounces)
Hardbounces:
-
Unknown address (e-mail address non-existent).
-
Unknown domain name (domain non-existent).
-
Other hardbounces (all other hardbounces).
You can download the bounce statistics as a CSV file. To do so, simply on the Action button and then on save as CSV file. An export as a CSV file even tells you which email addresses have been bounced.
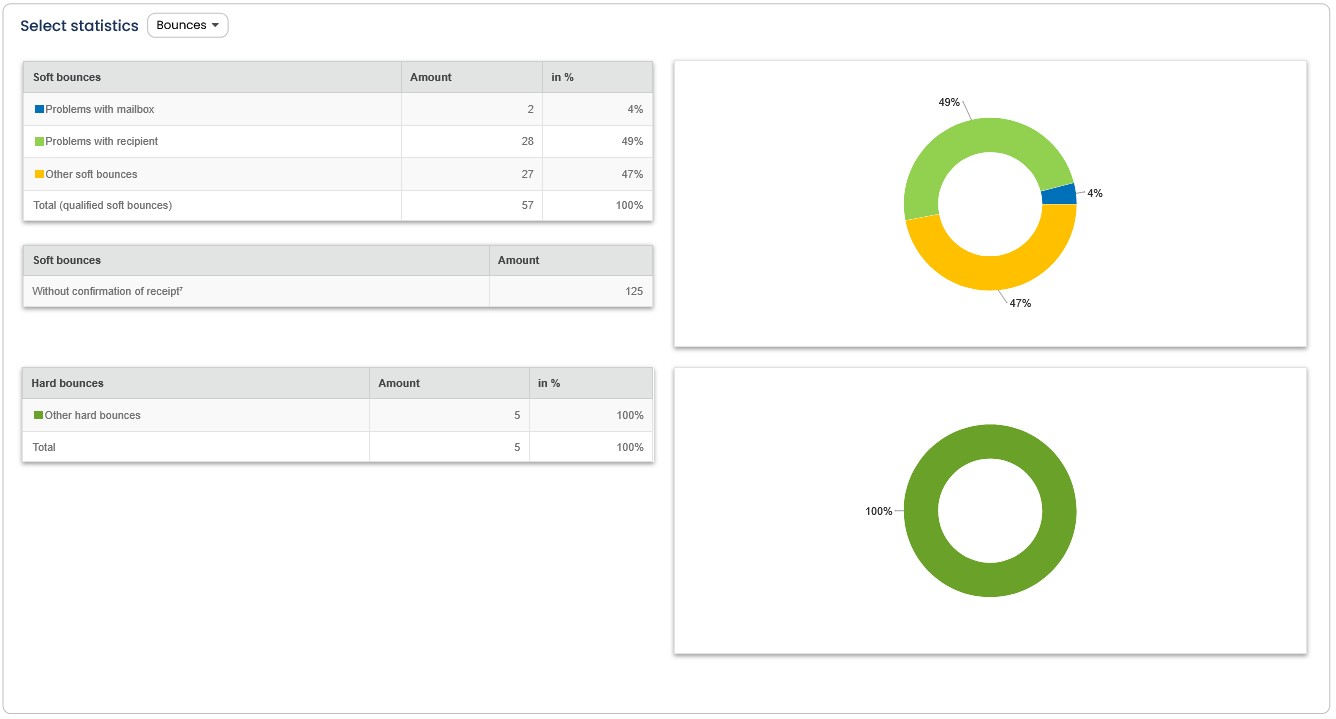
Fig. 9.12: E-Marketing Manager displays single bounces graphically and thus delivers important mailing information at a glance (scroll to see all the data).
Note: The Advanced Hardbounce Validation (part of the Delivery Package) only tries to reactivate recipients that have not been marked as bounce for more than 180 days. Since unused mailboxes are reassigned by the providers after a certain period of time, there is otherwise a risk that a recipient who has not granted you permission will accidentally slip into your distribution list.
10.2.9 Revenue
Clicking on the Revenue option brings up a detail page that reflects the tracking of the revenue in graphical and tabular form across time. The revenue is measured via the standard numerical tracking point Revenue. To modify the time axis, you can again utilize the Day, Month or Period selections.
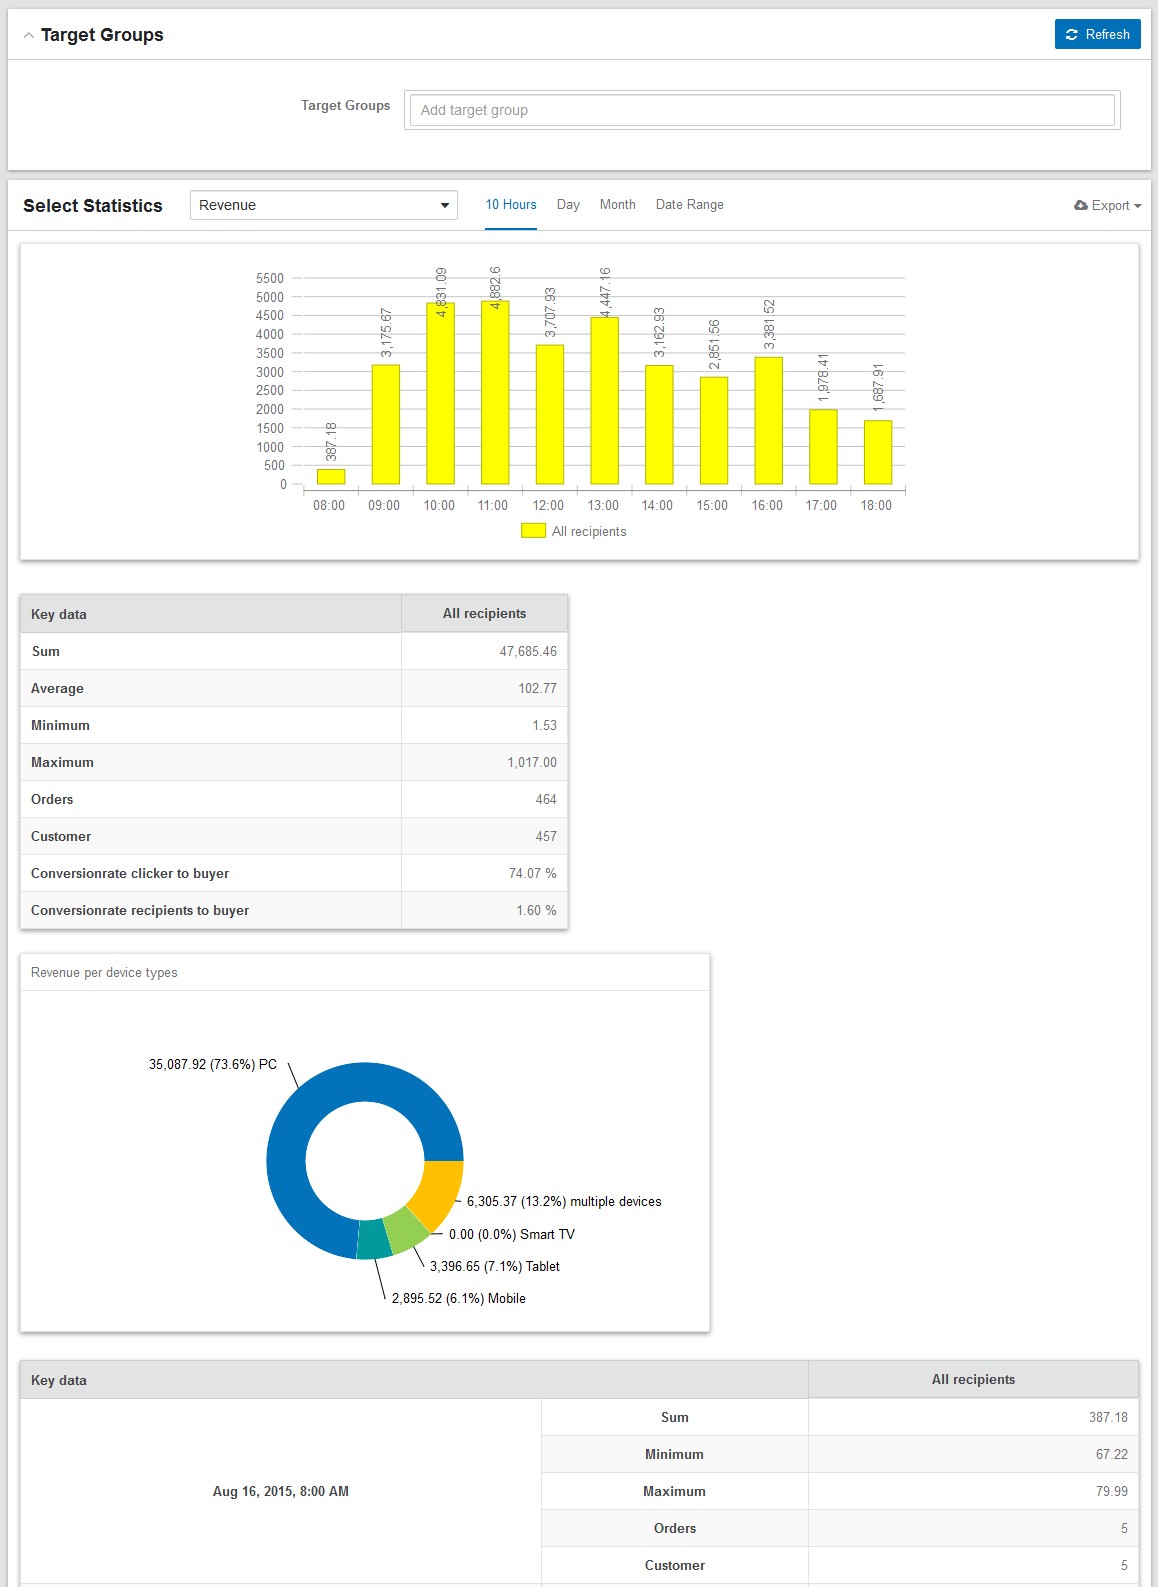
Fig. 9.13: Display of the Revenue statistics - it allows you to determine the success of a mailing
If the tracking process is continued into the shopping basket, and if a simple or a numeric tracking point has been set there, an additional statistical evaluation of the turnover generated by a mailing is shown below the delivery statistics.
It is also possible to display the data by target groups.
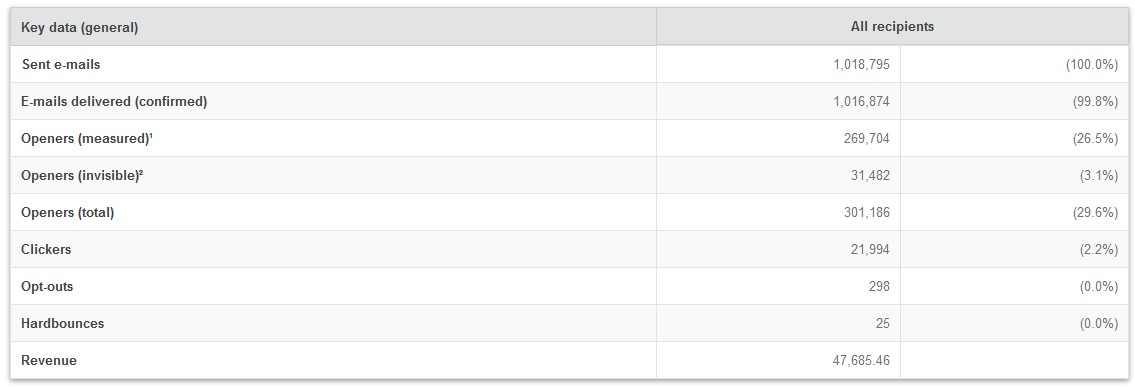
Fig. 9.14 The illustration of mailing statistic with activated Behavior Tracking.
10.2.10 Benchmark
How well did the mailing you sent do compared to the competition? You can see this at a glance in the Benchmark module. In this section, E-Marketing Manager compares several important key indicators of the mailing (opening rate, click rate, deregistration rate and bounce rate) with the average values for this sector. E-Marketing Manager presents each of these four key indicators as a bar chart that includes the associated percent values. The green bar represents the better result and the red bar represents the worse one.
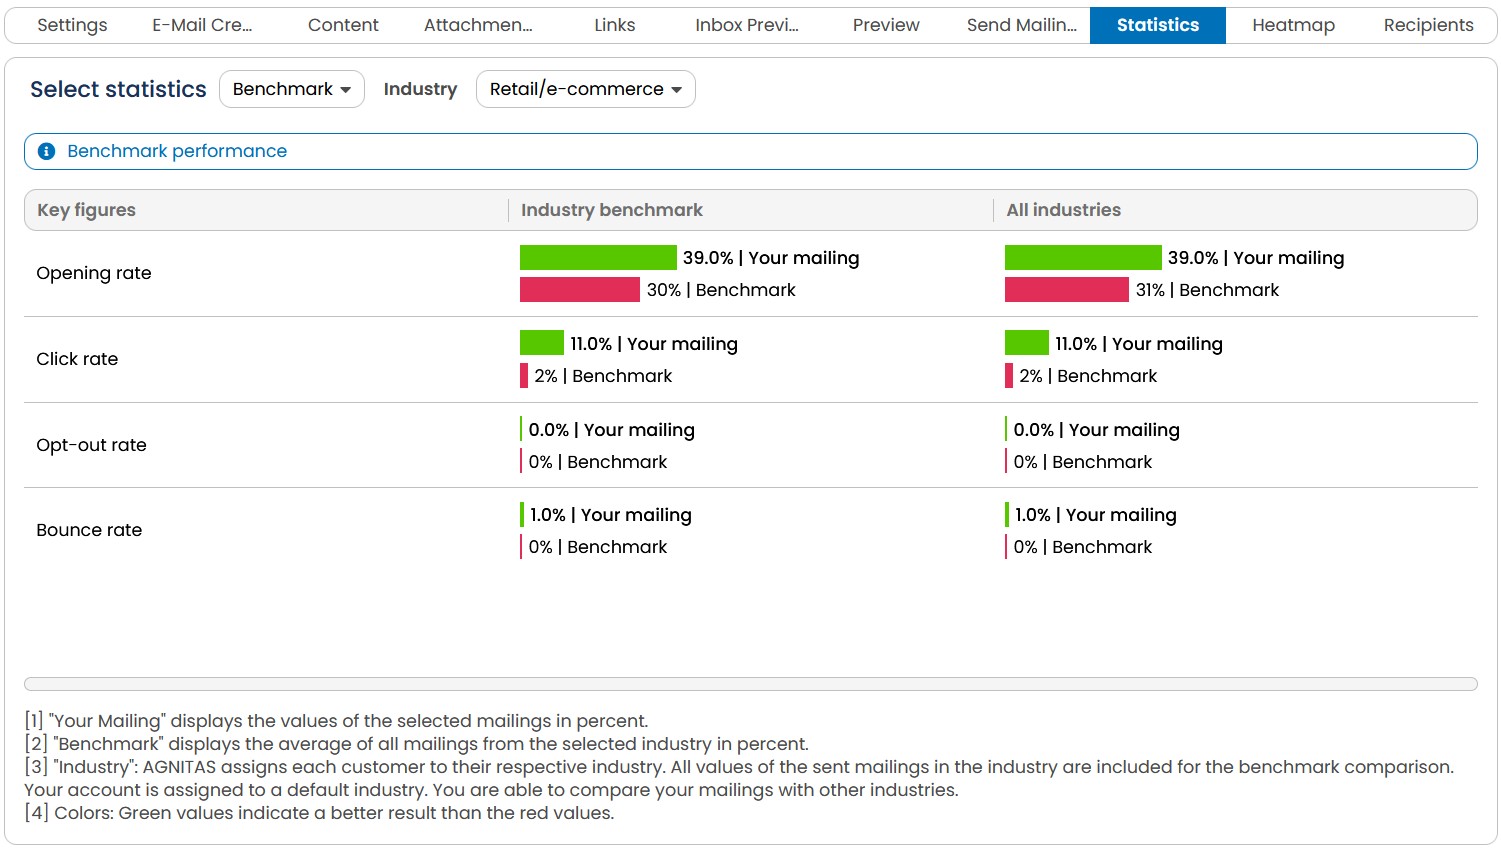
Fig. 9.15: In the Benchmark statistics, E-Marketing Manager compares important key indicators of a mailing with average values for the sector.
You can change the sector being compared to at any time by selecting the Industry menu and then clicking on Refresh. The following sectors are available:
-
Agencies
-
Communities/Clubs
-
Tourism
-
Finance
-
IT/Telecoms
-
Retail/Commerce
-
Manufacturing Industry
-
Consumer Goods
-
Publisher/Media
-
Non Profit Organizations
-
Education
-
As standard, E-Marketing Manager shows the sector to which your account has been assigned. If you belong to another sector, you can change the sector in the Administration tab.
Please note:
-
The statistics in the Benchmark are updated on a daily basis and are available at the earliest 5 hours after delivery.
-
The target group and recipient selection does not influence the results.
-
The Benchmark statistics cannot be displayed for license and private-cloud versions of E-Marketing Manager.
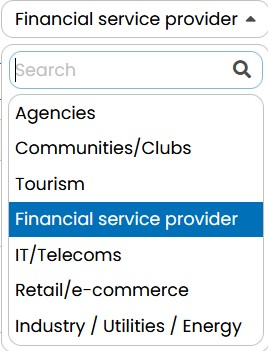
Fig. 9.16: Select the sector to be used for comparison by means of the Industry menu.
10.2.11 Comparing target groups
In the default preset condition, the mailing statistics show the data for all recipients of the mailing. You can, however, only show the data for recipients in a specific target group. You can also show the data for multiple target groups, thus allowing you to compare the data. Any number of target groups can be shown in parallel.
-
First select the desired target group via the Target groups list.
-
If you want to compare several target groups, you can select these in the list by simply clicking on one after another. E-Marketing Manager automatically adds them to the list. Update the display with Refresh.
-
E-Marketing Manager now shows the click statistics of the ticked target groups in numerical format.
-
After selecting, you can delte individual target groups by clicking on the small radio button with a X icon on the left to the target-group name. Confirm the selection with Refresh. The target groups no longer appear in the comparison statistics.

Fig. 9.17: With the Target groups drop-down you add more target groups to your statistic.
Please note: If an activated target group has no results, it will not be shown.