1.5 Evaluating mailing results
This chapter introduces you to the various ways in which you can check the success of your mailing in EMM.
Content of this chapter
-
Detailed evaluation of individual mailings
-
Compare several mailings with each other
-
Monthly overview
-
Receive automatic reports after dispatch
Note: In addition to the mailing-related statistics, E-Marketing Manager offers numerous other statistics that are not covered in the quick start.
1.5.1 Detailed analysis of individual mailings
You can access the statistics of a mailing in several ways:
-
Firstly, you can open the desired mailing via the dashboard. If you are not automatically forwarded to the Statistics tab, simply click on it. Of course you can also open the mailing from the Mailings section in the overview and navigate to the corresponding tab.
-
On the other hand, you will find the item Statistics with various sub-items in the main navigation. Here you call up the entry Mailing (separate). The list displayed contains all the direct mailings that have already been sent. By clicking on an entry, you also land in the statistics tab of the selected mailing.
Once you have reached the Statistics tab, the summary is displayed first by default, as this is the most frequently used statistic. This tab, however, conceals several different statistics that you select using the dropdown and which are presented here in order. In the upper area you can add target groups for the analysis. The system then displays the values for all recipients of the direct mailing as well as for the recipients of a specific target group. You could, for example, analyze the opening and clicking behavior of women and men separately. With Percentages based on delivered mailings you can change the calculation basis from Sent Emails to Accepted Emails, since bounces have no possibility to react.
-
Summary: In this evaluation you will find the most important key figures for a mailing, from the number of e-mails sent and accepted as well as opening and click rates up to unsubscriptions, bounces and, if applicable, sales. The numbers are displayed in absolute values and as a percentage. Furthermore, the openings and clicks are broken down by device type. At the very bottom the number of all clicks is put in relation to all openings. The activity rate determined in this way is also known to many as the Click Through Rate.
-
Click statistics per link: This statistic evaluates all measurable links of your mailing.
You will find both the number of clickers and the actual clicks for each measurable link. The numbers are displayed in absolute values and as a percentage. Anonymous clicks are also listed here. However, since
-
is traceable, who or how many persons clicked anonymously, no number for clickers can be given here. The proportion of mobile clicks is shown separately. The EMM evaluates productive links (i.e. links that contribute to advertising success) and administrative links (links that have no advertising character) in two separate tables.
-
Dispatch over time: These statistics show the time course of the delivery of your mailing. In the bar chart shown, the mails sent per 10 minutes are summarized. With small print runs it is of course possible that only one value is shown here, as the mailing was completed in less than 10 minutes.
-
Openings over time: More exciting is probably the distribution of the openings. You can display different time periods for this purpose: From 10 hours after dispatch, over a specific day, month or individual period, you have various options. The diagram shows the values broken down by end device. Openings can only be entered in HTML format.
-
Click statistics over time: The same analysis options as for openings are also available for clicks.
-
Top Domains: With these statistics the E-Marketing Manager offers you the possibility to evaluate the mailing according to the most important e-mail domains of your recipients. You can display the top 5, 10 or 15. An evaluation based on the top level domains is also possible. Note: The values for hardbounces and softbounces are only available for a period of 180 days. The analysis of sent e-mails by top domain is only possible with the Automation Package.
-
Bounces: Under this point you will find a detailed overview of undeliverable mailings.
The statistics distinguish between hard and soft bunches and show the reasons (e.g. mailbox problems or unknown address) for failed delivery.
-
End device statistics: Gives you an insight into which end devices (Top 10) your mailing was opened or clicked on most often.
-
Revenue: If you have integrated a tracking pixel for sales measurement on your order confirmation page, you will receive the sales of your mailing per day broken down by Total sales (sum), minimum order value (minimum), maximum order value (maximum), number of orders and number of buyers. A diagram also shows the distribution to the end devices.
-
Benchmark: In these statistics, the E-Marketing Manager compares the most important key figures of the mailing with the average values, within the same industry and across all AGNITAS customers. Using a drop-down menu, you can also select other industries as a basis for comparison.
1.5.2 Comparing mailings
E-Marketing Manager also gives you the opportunity to compare the most important key figures of up to ten mailings. To do this, call up the Statistics item in the main menu and choose Mailing (comparison). All the mailings you have already sent are listed here. In the first column, simply select the mailings that you want to compare. If you wish, you can also add target groups to your comparison. By clicking on Compare, you can see a comparison of the mailings. First, the absolute and percentage values for e-mails sent, e-mails accepted, openers (of all kinds), clickers (including anonymous), Opt-outs, hard bounces, without confirmation of receipt and revenue are displayed in a bar chart. The following table compares the figures for the mailings without any further graphical representation.
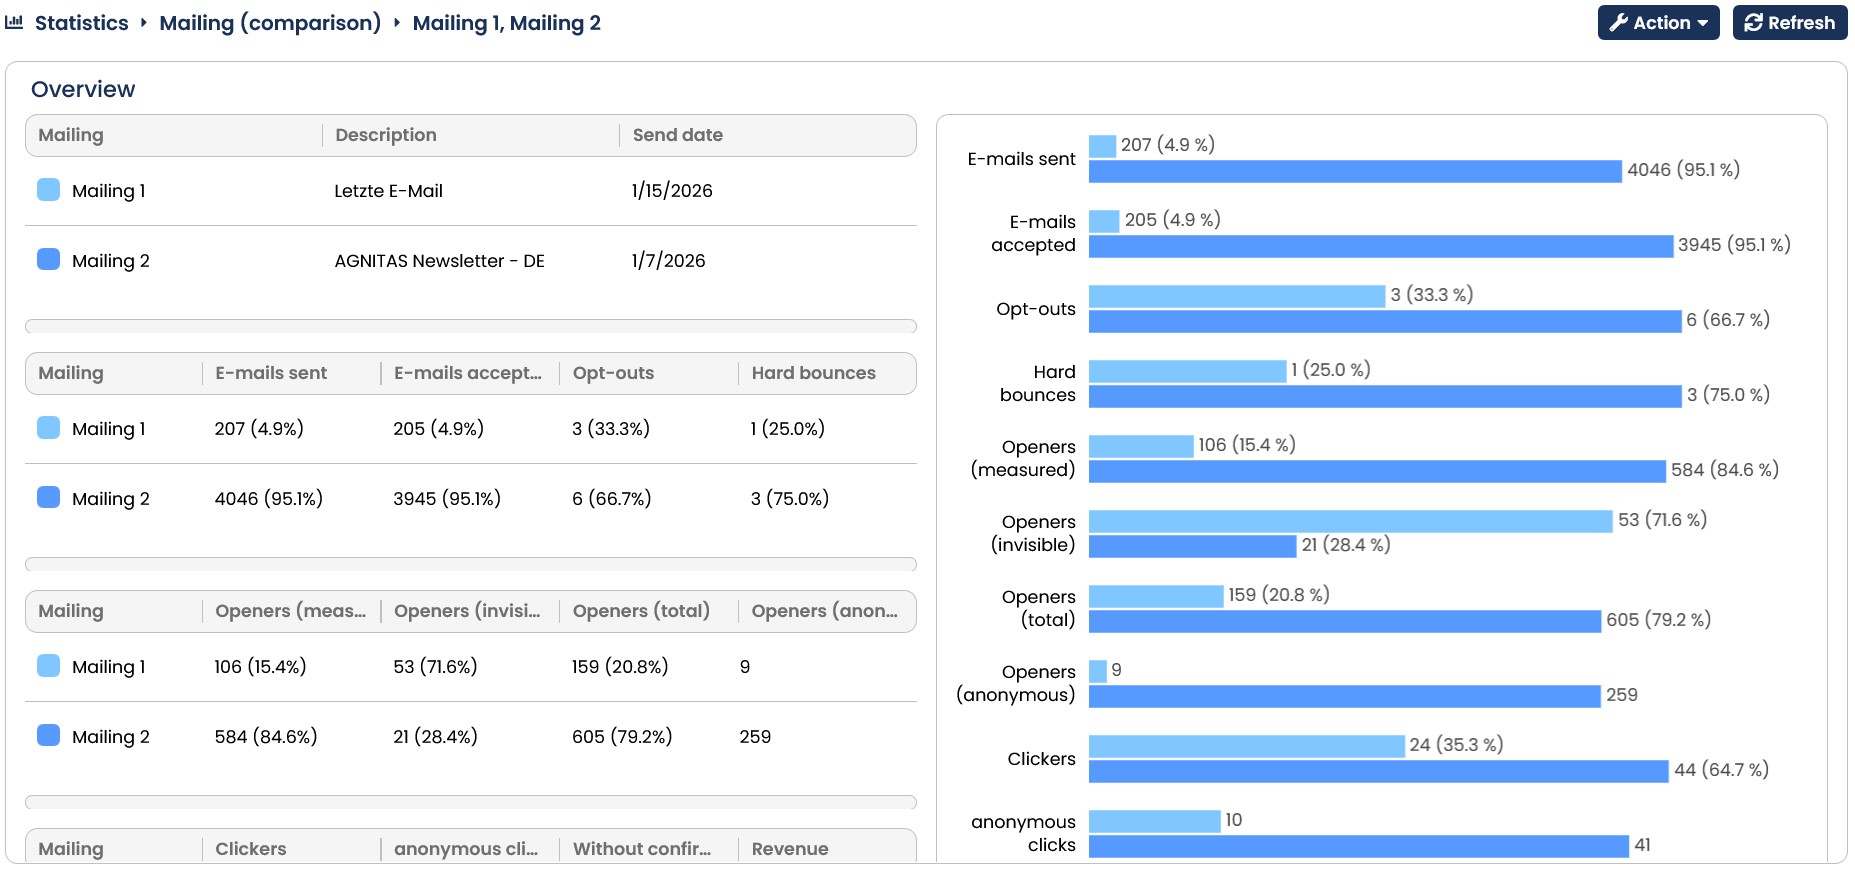
Fig. 16.52: The mailing comparison menu item allows a comparison of up to ten mailings.
1.5.3 Monthly overview of all mailings
In order to get an overview of the amount of emails sent each month, use the submenu monthly overview in the statistics menu item. Here you can view the top 10 mailings per recipient, opener and clicker, as well as track all mails sent per day. Here you can see not only the normal mailings, but also action-, date- and interval-based mailings. This gives you a complete overview of all emails that have left E-Marketing Manager in the selected month.
1.5.4 Automatic Reports
In addition to the evaluation options within E-Marketing Manager, you can also have automatic reports sent to you by email. To do this, call up the Reports item in the
Statistics menu. Here you can see all the reports you have already created. By clicking on an entry you can edit it. You have the possibility to create a new report by clicking on New in the top right corner.
Here it is advisable to provide a meaningful name and a detailed description. In the Delivery settings box, you specify who is to receive the report, its subject and the text for the email, as well as when and how often the report is to be sent and in which format. You can choose between the file types CSV and PDF. If required, you can also enter an end date here, in which case the report is set up accordingly.
On the right-hand side of your screen, you can choose between four types of report: Mailing comparison, Mailing statistics, Recipient statistics and Top Domains. In this section, you specify which key figures the report should contain. The report will only actually be executed if you enter all the information required for sending and activate a report type for sending using the switch next to its name. Once you have made all your settings, confirm them by choosing Save.
You can find out more about this topic in the Reports chapter of the manual.