10.12 Reports
You can regularly analyze the most important key indicators for your mailings without having to log in to E-Marketing Manager. Simply have reports such as mailing statistics and mailing comparisons, which you already know from E-Marketing Manager, be sent to you by e-mail.
You can modify the format and contents of the reports to match your needs and thus have full control over the point in time, scope and representation of relevant information.
In the menu, select the Reports section. You will see a list of already-defined reports. You can select a report to edit or delete by means of the icons on the right-hand edge of each column. Please note that you are not dealing with reports filled with data (these are sent to you via e-mail) but with report definitions that you use to determine when the reports are to be created and what data they contain. You can create any number of reports.
Note: Each new client already has three defined report entries at the beginning. These entries of the report types “Recipient statistics”, “Mailing statistics” and “Mailing comparison” should make it easier for you to get started.
To create a new report, click on New in the upper right. In the upper part of the window you specify the name and the sending settings.
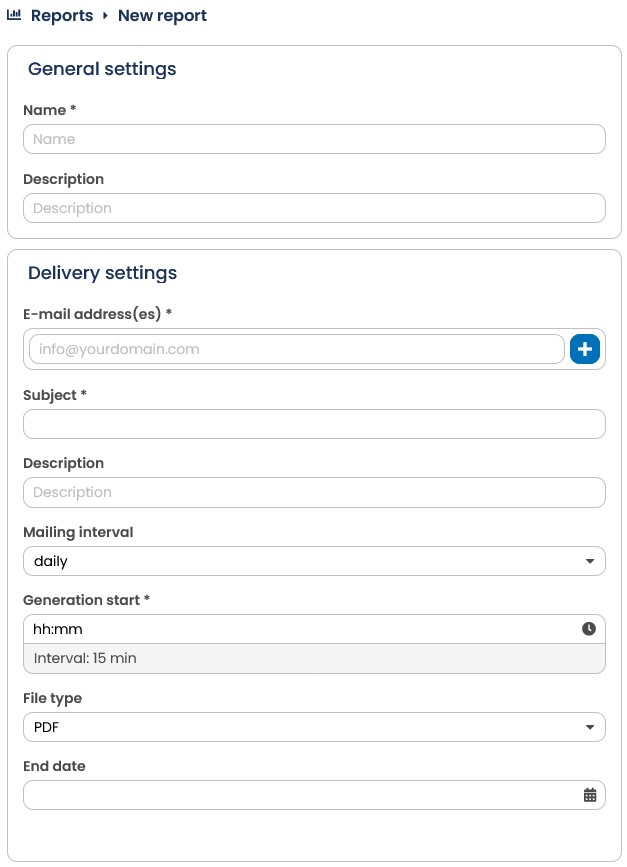
Fig. 9.27: Name and sending settings of a report
In the Edit Report section, give the report a Name and (optionally) a Description to be able to easily identify it later.
Then enter the e-mail address of the recipient, a Subject and (optionally) a Description in the Send report automatically section. You can enter multiple e-mail addresses, each separated by a comma.
Next you select when the report is to be created and automatically sent. Click the corresponding box or select the day of the month and the time of day. The time is valid for every sending day that you have selected.
Alternatively, you can select a specific time after each mailing is sent.
Then select whether the report is to be created as a PDF or as a CSV file. In PDF format, the key indicators are prepared in clear tables and color graphics. CSV files can be postprocessed, for example in a spreadsheet program.
Finally, specify the End date. The report is no longer created after this date.
In the right half of your screen, you configure the exact contents of the report: What data are you interested in? You can process four data areas separately:
-
Mailing comparison – clearly arranged comparison of the key indicators from two or more mailings
-
Mailing statistics – comprehensive statistical data separated out for selected mailings
-
Recipient statistics – information on the recipients of your mailings differentiated in time
-
Top Domains - Various key figures on the top domains of your recipients over a selfdefined period of time
Select the desired area by means of the tab.
If you wish to include the Mailing comparison, Mailing statistics, Recipient statistics and/or Top Domains in the Report, don't forget to activate the slider next to the corresponding header.
Under the Mailing comparison tab you determine:
-
Which mailings should be taken into account. You can choose between the last two, three, five or ten mailings or alternatively you can compare all mailings from a selected period, e.g. previous day, last 7 days, last 30 days, last month, individual period. Furthermore you can set a filter by choosing either an archive or a mailing list.
-
The mailings to be compared to from a list of mailings. In order to do so, first choose Select mailings and then select the desired mailings in the drop-down menu. You can remove selected mailings by clicking on he small radio button with a X to the left of the mailing's name.
-
What Target groups should be taken into account. The selection functions in the same way as for normal mailings.
-
What key indicators the report should contain. You can select all or individual key indicators by clicking the corresponding check box.
The button Toggle On/Off provides you with the possibility to select or deselect all check boxes at once.
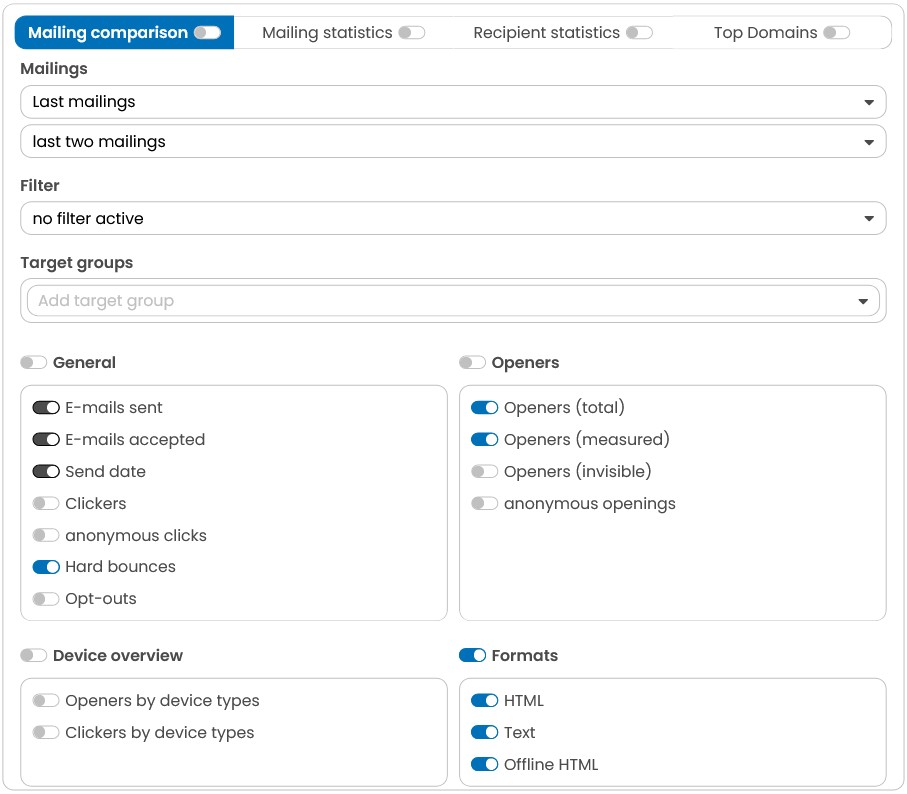
Abb. 6.28: The key indicators for the mailing comparison
Under the Mailing statistics tab you determine:
-
How many Last mailings (only if you select the mailing type Normal Mailing) should be taken into account. You can choose between the last two, three, five or ten mailings. Furthermore you can set a filter by choosing either an archive or a mailing list.
-
The mailing-selections to be compared to from a list of mailings if you want to create a specific selection of mailings. In order to do so, first choose Select mailings and then select the desired mailings in the drop-down menu. You can remove a selected mailing by clicking on he small radio button with a X to the left of the mailing's name.
-
Which Mailing type you want to have in your report.
-
What Target groups should be taken into account. You can those easily via the selection menu.
-
What key indicators the report should contain. You can select all or individual key indicators by clicking the corresponding check box.
The button Toggle On/Off provides you with the possibility to select or deselect all check boxes at once.
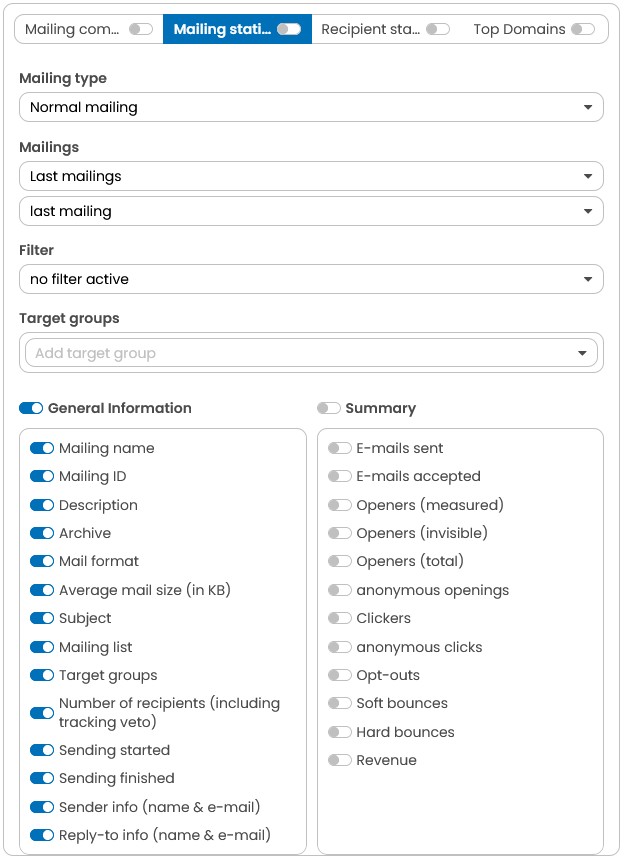
Fig. 9.29: The key indicators for Mailing statistics.
Under the Recipient statistics tab you determine:
-
What Period and Date Range the report should cover. Concerning Period, you can choose between Predefined or Custom. The Date Range for the Predefined setting will either be the last 7 days, last 30 days or last 3 months. When choosing custom in the Period dialog field, you may define a specific date range by choosing specific days.
-
What Mailing lists should be taken into account. Simply choose as many mailing lists as you like in the corresponding drop-down menu.
-
What Target groups should be taken into account. The selection functions in the same way as for normal mailings.
-
What key indicators the report should contain in the Key figures area. You can select all or individual key indicators by clicking the corresponding check box.
The button Toggle On/Off provides you with the possibility to select or deselect all check boxes at once.
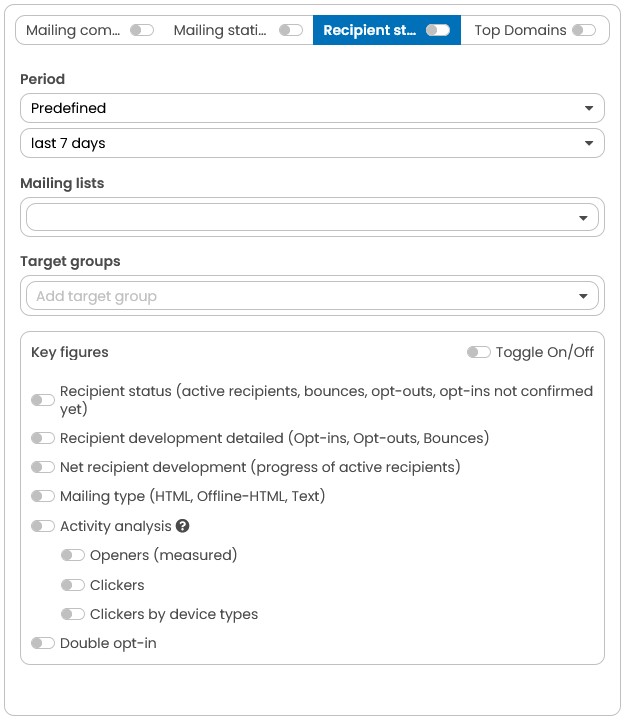
Fig. 9.30: The key indicators for Recipient statistics.
The Top Domains tab has the same settings as the Recipient Statistics tab. Only the Key Figures section differs.
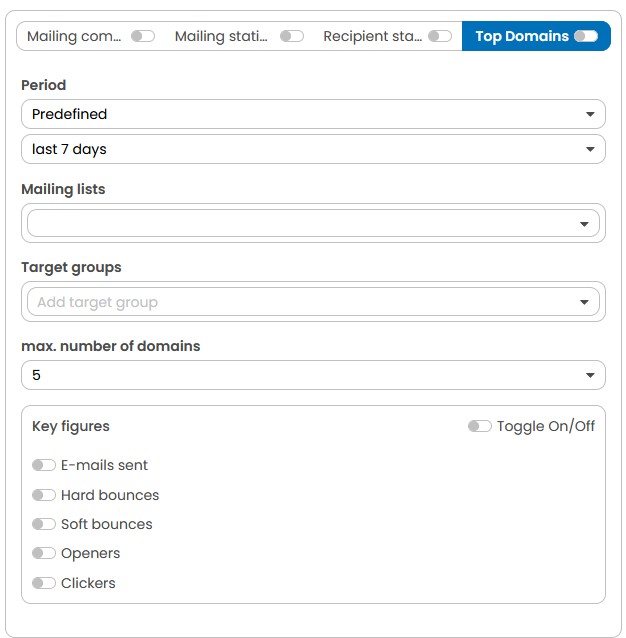
Fig. 9.31: The key indicators for top-domains
By clicking Action you can delete the report or generate a download by clicking Evaluate.
The following illustration shows an example of several possible elements from report in PDF format:
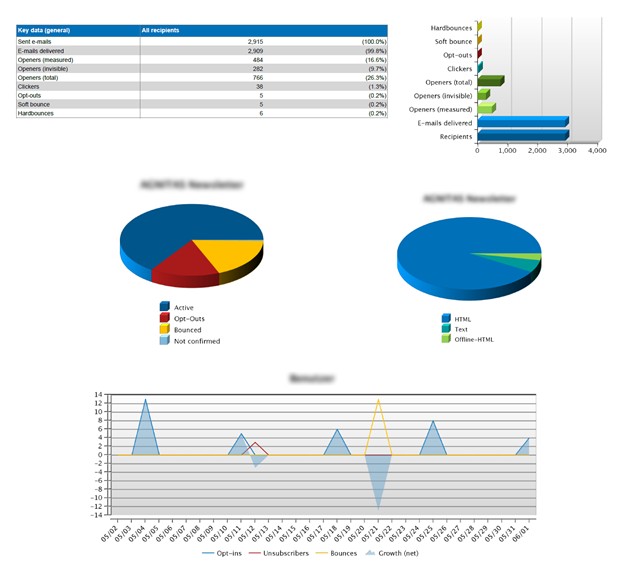
Fig. 9.32: Extract from a report.
Note: You can make changes to an already existing report and based on this, have a new report generated without having to save it.
Also note: You can select a maximum of 10 action-based or date-based mailings per report.